
It’s no secret the Google Chrome browser leads the browser market share worldwide. With 63.59% of the world using Chrome (as of 2021, estimated by StatCounter), the application’s prowess and functionality will only continue to grow. With Google expanding it’s reach beyond it’s Android Auto application, directly into Android Automotive, we can probably expect to see Chrome on the dashboard of your next EV.
Chrome is packed with tons of features, but one of the more mysterious and perhaps, hacker-like, toolsets isn’t known to as many as it should be! That toolset would be the Chrome Developer tools. Even if you don’t fancy yourself a developer, they can be super handy to know how to use for some neat browser tricks.
Let’s take a look at some of my favorite Chrome DevTools Tips and Tricks to enhance your productivity!
What is the Google Chrome DevTools?
The Google Chrome Developer Tools, also known as Chrome’s DevTools, are web authoring and debugging utilities integrated directly into the browser. They provide Chrome users with deeper access and insight into websites and applications running in the browser. With the DevTools, you can do almost anything from testing the way a website looks on a specific type of mobile device, measure the performance of your site (or any site!) and the way certain assets are loaded, and you can even make neat edits to pages making it look real!
Before we get too far, I’d like to point out for our more technically advanced readers, Chrome has 2 variations of DevTools:
- The version that ships with the latest stable public build of Chrome.
- And the version that ships with Chrome Canary, aka the nightly über-beta version of Chrome, aimed towards developers.
How to open the Chrome DevTools?
You can actually open the DevTools a few ways!
From the browser menu:
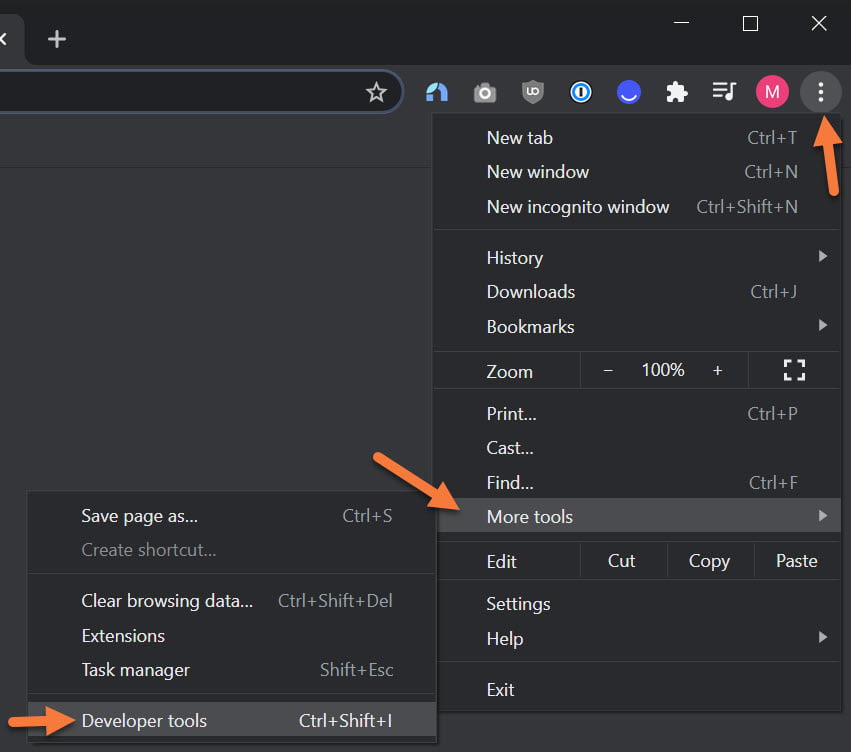
You can open the DevTools from Chrome’s main menu, then clicking More Tools, then click Developer Tools.
By Keyboard Shortcut:
As you can glean from the screenshot above, you can use Control + Shift + I (short for Inspect) on your keyboard to open the DevTools, as well as the F12 button on the keyboard.
For you Mac users, use ⌘ + Opt + I.
By right-clicking:
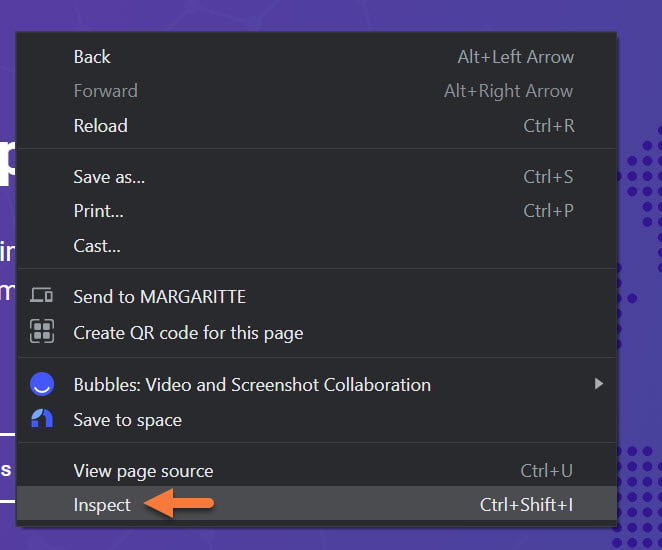
By far the method I use the most to open the DevTools is right-clicking anywhere in the whitespace of a website, then clicking Inspect or Inspect Element.
Tips & Tricks
Here are xx of my favorite Chrome DevTools Tips & Tricks you should know!
Check into the security of any site!
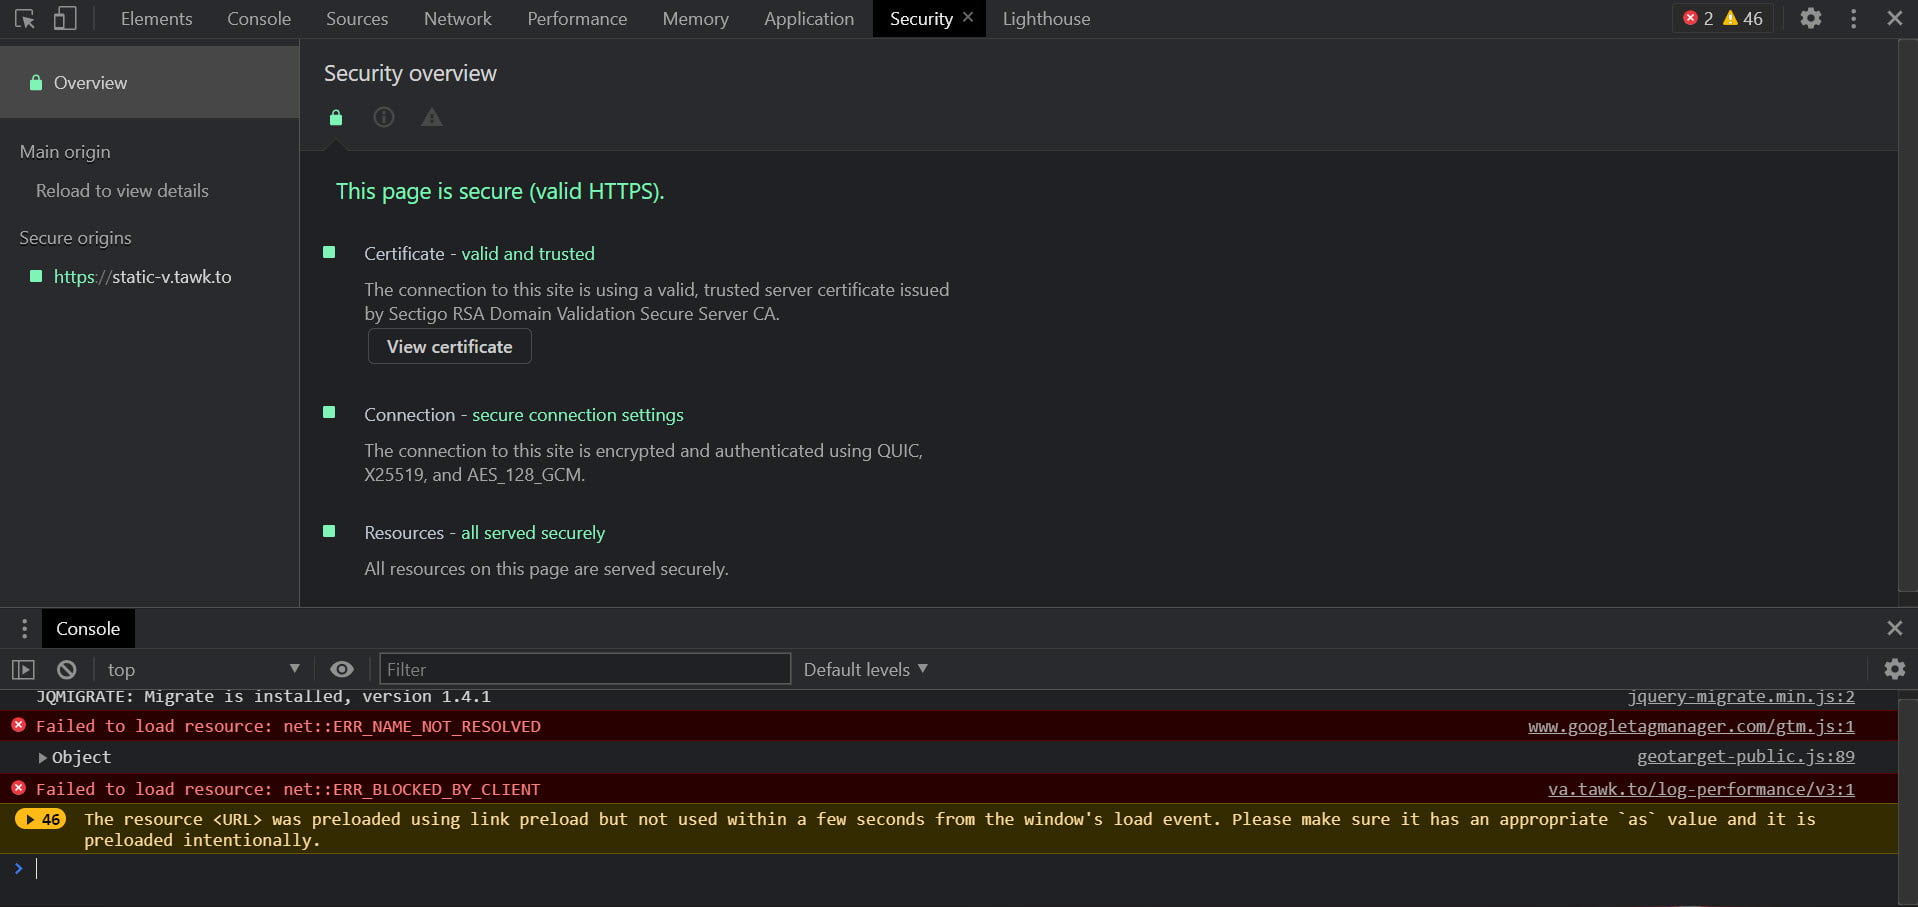
The Security panel of the DevTools is very useful if you want to check if the SSL/TLS certificate on the site you’re visiting is valid, whether or not the connection is secure, and if all resources on the page are being delivered securely. This tool is great for debugging things like HTTPS migrations and quickly fixing those annoying mixed content warnings.
To open the security panel, open the DevTools and click the Security panel.

Once the Security panel is open, press Control + R / Command + R to reload the page which will refresh the relevant security information.
Custom Network Throttling Profiles
Chrome’s latest version lets you add custom networking throttling profiles. This is really helpful if you want to simulate what it will be like to load your website on internet connections of varying speed and latency.
In the Network panel, click the Throttle dropdown menu, then click Add.
In the Network Throttling Profiles, click Add custom profile, and add the profile built to your spec.
Checking DOMContentLoaded
This feature allows you to see the exact time it took to load, and the total load time, of the DOMContentLoaded. You should keep tabs on these values because they are very beneficial in improving the overall performance of your website / application.
In the Network panel click on the settings icon, check the Show overview option, and then press Command + R / Ctrl + R to refresh the page. A blue line will show up for DOMContentLoaded and a red line for total load time. Normally everything that is left of or touching the blue line are the assets that are blocking the DOM, or also referred to as render blocking resources.
Monitoring Page Performance
The performance feature allows you to easily see what is costing you the most load time and resources. The performance detail results can be broken down in many different ways, such as the time, activity, and source, of the videos.
In the Performance panel press Cmd + E / Ctrl + E and then Ctrl + R / Cmd + R to refresh the page. Record the amount of time that you want to be monitored. You can then click Stop and evaluate the results.
Using the Network Filmstrip
The Network Filmstrip tool allows you to see how your page will render from start to finish by grabbing screenshots through the entire process. This is a great way to see how your font choices are rendering and if you’re dealing with issuers like FOIT and/or FOUT.
In the Network panel click on the settings icon, check the Capture screenshots option, and then press Cmd + R / Ctrl + R to refresh the page. After the page has refreshed it will show you how your page rendered from start to finish.
Copy image as Data URI
You can save any image from a website as a data URI, also known as base64 encoded. There is no need to use a free online converter app as it’s already built into Chrome’s DevTools.
In the Network panel, click on an image and then right click on it to have the option to Copy image as data URI.
Toggle Element States
If you’ve ever tried to figure out where a hidden style from, you’ve probably noticed it might be easier in Firefox than ChromeDevTools. However, while that exact feature might not be available in Chrome, something better is – Toggle Element State.
This feature allows you to force an element state, like :hover or :active, so that you can then use the styles panel to see the properties.
Change the way colors are presented
By pressing Shift + Click on the color blocks, you can toggle between RGBA, HSL, and hexadecimal formats.
Color palette and picker
Chrome’s DevTools include a custom color palette which will pull it’s colors from the website’s style sheet. You can access them by simply clicking on the color block in the styles panel. There is also a color picker which can be used to pick out colors from a web page directly.
Pick a device mode
You can use the device mode feature to test your website and media queries to see if your responsive design is breaking anywhere. You can also set a specific resolution to see if your page breaks so you know where to apply a media query.
To enter evice mode, click on the small phone/tablet icon in the Chrome DevTools or press Command + Shift + M / Control + Shift + M. You can then choose what device you want to emulate, add a network throttle, and even device the orientation of the device.
Clear Site Cookies
Chrome DevTools lets you easily clear cookies. This is especially helpful if you are testing or debugging plugins or Analytics.
In the Application panel, go to Storage, then click Cookies to either clear them all or an individual cookie.
Change the DevTools Docking Position
You can change the position in which Chrome DevTools docks itself. You have the option to undock it into it’s own window which is handy if you have a second or third monitor, or you can dock it on the bottom, left, or right side of Chrome.
To change the position with a keyboard shortcut, use Control + Shift + D / Command + Shift + D.
Edit HTML Elements
One of the coolest features in Chrome’s DevTools is the ability to edit HTML on the fly and preview those changes in the browser. To do this, choose any DOM element within the panel, and double click the opening tag to edit it.
In the lines beneath you, the closing tags are automatically updated and changes are rendered in the browser panel in real time.
Adding Multiple Cursors
Okay, this is probably one of my top 5 favorite features in Chrome DevTools. We just showed you how to edit HTML and change things on a page, but what if you have multiple lines you need to edit with the same changes. You can easily add multiple cursors by pressing Control + Clicking or Command + Clicking. After doing this, you’ll be able to edit multiple lines of code simultaneously.
Go to a specific line number
You can automatically skip to a line in your code Control + O / Command + O. That’s O for Oscar, if you have a hard time distinguishing a 0 from a O. 😉
When jumping to a specific line, you need to use the line syntax. For example, entering :42:24 will take you to line 42 column 24.
Setting JavaScript breakpoints
Debugging JavaScript can be a pain and sometimes it’s useful to set a breakpoint. You can do this in Chrome DevTools by clicking on the line number you want to break out, then press Control + R / Command + R to refresh the page. The page will then run right to that breakpoint.
Search your source code
You can easily search all of your source code by pressing Control + Shift + F / Command + Option + F.
Edit CSS Properties
Just as you can edit HTML, you can also change CSS properties in Chrome DevTools and instantly preview what the result will look like. Simply select the CSS element you want to edit, and under the styles panel you can add/change any CSS property you want.
Pretty Print
Chrome DevTools has a Pretty Print feature which makes code much easier to red. You can easily change the formatting of the code by clicking the {} button.
Switch files quickly
You can access any file within aq current project or website by pressing Control + P / Command + P when Chrome DevTools is open, then search for the name.
Summary
As you can see, Chrome’s DevTools is equippped with numerous features, from the easy to use to the advanced, to help you develop better and debug faster. These tools also help you measure performance of your site so you can ensure things are working as they should.
Do you have a favorite DevTool we didn’t mention? Let us know in the comments!