

Back in 2020, which oddly feels like forever ago, popular website benchmarking site GTmetrix updated their platform with the biggest change yet, replacing PageSpeed/YSlow libraries with Lighthouse, the industry standard web performance platform. With this addition of technology, the new GTmetrix Report has been completely redesigned to incorporate the Lighthouse data and metrics.
GTmetrix also came up with a new scoring system, which includes the new GTmetrix Grade, alongside the new Performance and Structure Scores. With the new GTmetrix report, you can learn more about the performance of your site through new tabs, visualizations, graphs, and deeper insights.
In our blog on Everything You Wanted To Know About GTMetrix Reports and Then Some, we’ll explain in detail all of the updates to the GTmetrix report and how you can use GTmetrix reporting to improve the performance of your own website.
Let’s dive in!
Table of Contents
What is GTmetrix?
GTmetrix is a website benchmarking tool developed by Canadian a company called GT.net. The GTmetrix tool allows users to easily learn how quickly their site is or isn’t performing, where it’s doing well, and where it’s not doing so hot. GTmetrix has earned a reputation of being the most popular benchmarking tool on the Internet to date. Here at ChemiCloud, we use the tool to help our customers learn about their site so they can make improvements. GTmetrix is known for being easy to use and understand, which makes it great for newbies and experienced developers alike. GTmetrix is trusted by companies such as BMW, HPE, Hasbro, Bayer Pharmaceuticals, T-Mobile, Nordstrom, Thomson Reuters, and more. If it’s good enough for them, it’s good enough for the rest of us, I say!
What is Lighthouse?
Before we dig into GTmetrix, I’d like to cover the new technology they are using – Lighthouse.
Lighthouse is a tool developed by Google to analyze web apps or web pages and collect modern performance metrics and insights to help developers tune their website or web app for the best performance possible. You can run Lighthouse against any web page, whether it’s public or one which requires authentication. It has audits for performance, accessibility, progressive web apps, and more.
You can run Lighthouse in Chrome’s DevTools, from the command line, or from a Node module. Just give Lighthouse a URL to audit, and it will run a series of tests against the page, then generate a report on how well the page did. From there, you can use the test results to improve things. Each test has a reference doc that explains why it’s important and how to fix it.
Running Your First Test With GTmetrix
GTmetrix offers its service in two forms, free accounts, and premium accounts. The key differences in the paid accounts are you get access to the premium test locations and you can run more tests per week.
With a free GTmetrix account, you get access to servers in the following free test locations:
- San Antonio, Texas, USA
- Vancouver, Canada
- São Paulo, Brazil
- London, United Kingdom
- Mumbai, India
- Hong Kong
- Sydney, NSW, Australia
With a paid account, you have access to the above locations, but also the premium servers listed below:
- San Francisco, California, USA
- Cheyenne, Wyoming, USA
- Chicago, Illinois, USA
- Danville, Virginia, USA
- Quebec City, Quebec, Canada
- Stockholm, Sweden
- Amsterdam, The Netherlands
- Frankfurt, Germany
- Paris, France
- Dubai, United Arab Emirates
- Johannesburg, South Africa
- Chennai, India
- Busan, South Korea
- Tokyo, Japan
If your website garners a lot of attention in a specific region, having a premium account can be very handy to get more local with your tests.
For this blog, we’ll be using a free account. First, let’s look at how to customize our test:
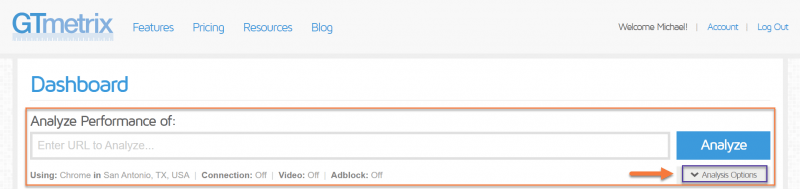
When running your test, you have the option to configure a variety of options, many of which are very useful, by clicking the Analysis Options dropdown.
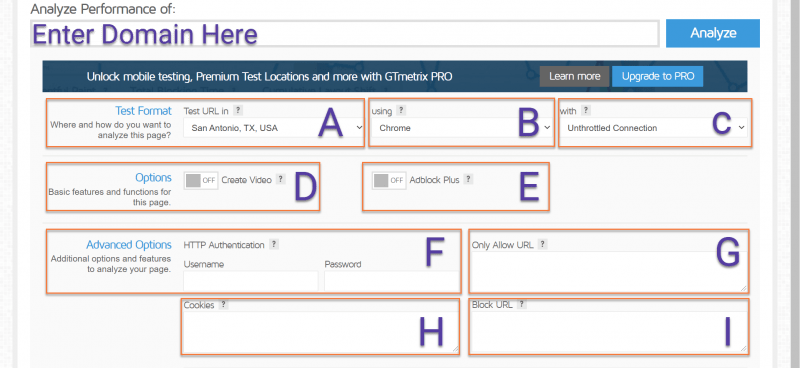
Let’s break down these options, as there are quite a few here.
- A – This is the server setting. If you click the drop-down menu you have the option to change between the different servers available for testing.
- B – You can change the browser agent/device type for testing. If you are testing what your site looks like on an iPad or a specific type of phone, this is the drop-down menu for you. Keep in mind, you can only select another device if you have a Pro account.
- C – This setting allows you to throttle the connection so you can experience what it’s like to load your site on a certain type of connection, like dialup or 3G/4G Mobile.
- D – This setting allows you to debug page load issues by seeing exactly how the page loads with the test environment. You can then view the page up to 4 times slower to help pinpoint rendering or other page load problems.
- E – Using the AdBlock Plus setting, you can see if the famous AdBlock Plus plugin rules affect your page performance or CSS/asset loading, as can happen with certain configurations. Also, if you have ads on your site, you can see what it’s like to load your site without the ads and get those performance insights.
- F – If the site you’re benchmarking requires HTTPS authentication, this is where you’d enter it.
- G – With the Only Allow URL option, you can have GTmetrix only load resources that match one or more of the URLs on the list.
- H – If you’re testing pages that require the user to be logged in, like a checkout page for example, or a wish list, you can insert the cookie and session ID here to simulate that.
- I – With the Block URL feature, you can prevent the loading of resources that match one or more of the URLs on the list.
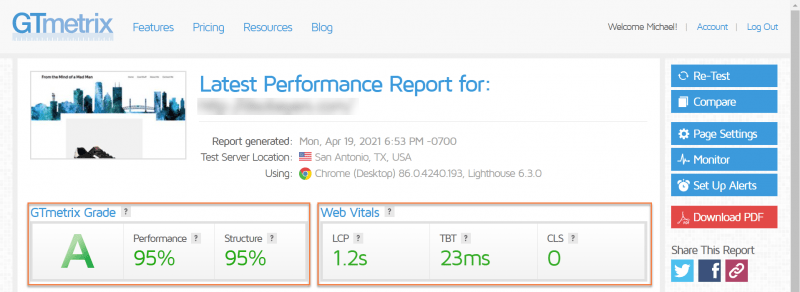
Now that we’ve covered the settings, let’s run our test! I’m going to run a test from San Antonio, TX since that location is pretty close to the server location where we’re hosting our test site.
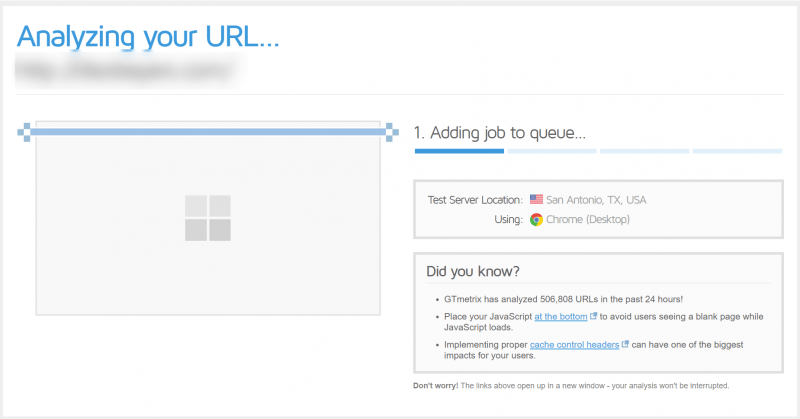
Now that our text has been run, let’s examine the results!
Interpreting GTmetrix Results
The reports that GTmetrix generates are very informative, but also exceptionally detailed. As a result, understanding them can be somewhat challenging. Let us make that easy for you by explaining what the insights mean for you and your website/application.
Grading and Scoring Details
The scoring system used in the new GTmetrix Report is loosely based on Lighthouse’s scoring system. However, testing has been enhanced and slightly tweaked by GTmetrix’s own proprietary configuration to deliver the results their tool does. The end result is the new GTmetrix Grade.
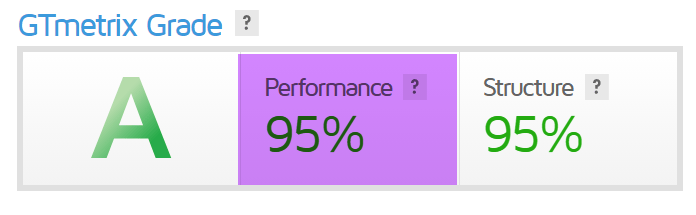
What is the GTmetrix Grade?
The GTmetrix Grade is a weighted grade that is derived from the results of the new Performance and Structure scores, which replace the old PageSpeed and YSlow scores from legacy reports.
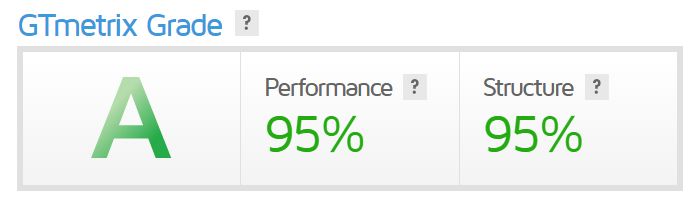 The GTmetrix Grade is a weighted average of the two new percentage-based scores:
- The Performance Score, which comprises 70 percent of the total score.
- The Structure Score, which comprises the remaining 30 percent of the total score.
The GTmetrix Grade is based on a very simple formula that currently assigns a 70/30 weighting for the Performance and Structure Scores, respectively.
Keep in mind, while this is the current configuration for the GTmetrix Grade, GTmetrix is constantly tweaking and updating its formulas, and over time they will evolve. It’s only been since November 2020 they started using this new method.
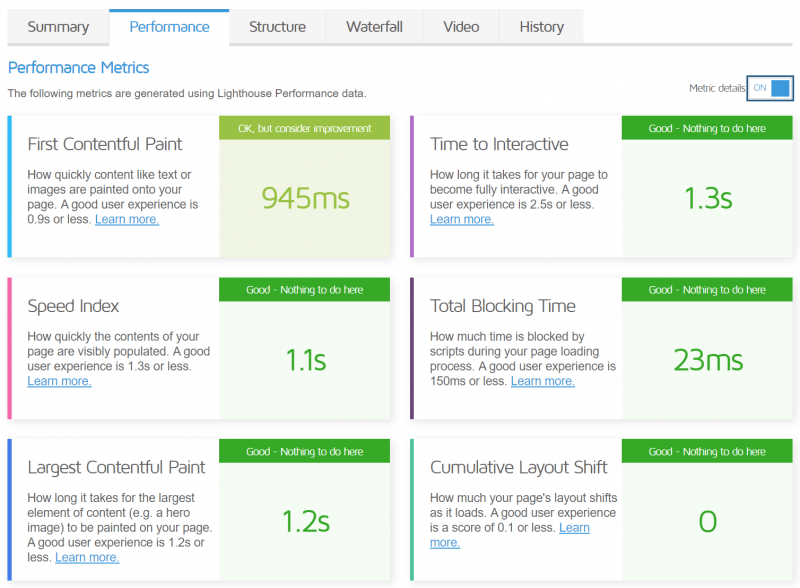
Breaking Down the Performance Score
The performance score tells you how well your page performs from a user perspective.
 When you run the numbers, the Performance Score is your Lighthouse Performance score as captured by the GTmetrix tests, using their browser, hardware and software code, and any options you specified, such as AdBlock, Connection Speeds, etc..)
Let’s look at how the Performance Score breaks down:
The Performance Score is made up of 6 key metrics with the following weights:
- Loading performance, which makes up 55% of this part of the score. This score breaks down as follows:
- First Contentful Paint – 15%. This metric measures how quickly visitors can view actual content on your site, like text, images, and video.
- Speed Index – 15%. This metric measures how quickly your page is visually complete above the fold.
- Largest Contentful Paint – 25%. This is a performance metric introduced in 2020 by Lighthouse to better measure the perceived loading experience for users. This is also one of the metrics making up Google’s Web Vitals, for reference.
- Interactivity, which makes up 40% of the part of this score. This score breaks down as follows:
- Time to Interactive – 15%. This is a performance metric that measures a page’s load responsiveness and helps identify situations where a page looks like it’s an interactive page, but it actually isn’t.
- Total Blocking Time – 25%. This is a performance metric from Lighthouse introduced in 2020 which measures the total amount of time your webpage was blocked from user input. This is also one of the metrics making up Google’s Web Vitals, for reference.
- Visual Stability, which makes up 5% of the part of this score. This score breaks down as follows:
- Cumulative Layout Shift – 5%. This is a performance metric introduced in 2020 from Lighthouse which measures the perceived visual stability of a page load, i.e. unexpected shifting of web elements on the page as it loads. This is also one of the metrics making up Google’s Web Vitals, for reference.
Each of these metrics is measured + calculated as a score, then compared to a threshold, and the aggregate result, with appropriate weighting, makes up the final Performance Score. The findings of the Performance Score are available in the Performance Tab of the GTmetrix report.
GTmetrix Performance Score vs Google PageSpeed Insights or web.dev
Even though Google’s PageSpeed Insights and web.dev are driven by Lighthouse, they use their own hardware and testing methodologies to create your Performance Score. There are a few key differences that make the score from Google’s tool vary from GTmetrix, which include:
- Geographic differences.
- Hardware differences.
- Network differences.
- Other “Google-Magic”
The scores generated from Google’s tools and GTmetrix’s Performance Score should be similar, but they won’t be directly comparable. It’s important to understand the reasons why.
GTmetrix uses a real browser to load your page with an Unthrottled Connection, unless you specify otherwise, using their specific hardware and test options. Some of these options, such as location, connection speed, and screen resolution, for example, can be changed based on the user requirements.
PageSpeed Insights and web.dev launch performance tests using headless and emulated browsers, and use network throttling to simulate page load under different network conditions. Unlike with GTmetrix testing, you cannot change these test options, such as location, connection speed, or screen resolution, among other options.
Moreover, the Google Tools, PageSpeed Insights, and web.dev, use Lantern, which results in significantly different page loading behaviors, yielding different performance scores and test results.
Examining the Structure Score
The Structure Score is a proprietary assessment of Lighthouse Opportunity and Diagnostic Audits, to be precise. The team at GTmetrix took the audits from web.dev and assigned point values to them based on numerous factors, including potential savings and importance, as perceived by their team. Similar to PageSpeed and YSlow scores in the Legacy Reports, how well you do on your Structure Score is reflective of how well your site is built and optimized.
The team at GTmetrix also included some of their own audits they deem important to website/web app performance, which we’ll cover below:
- Enable Keep-Alive
- This triggers only on pages using HTTP/1.1 with no Keep-Alive ON directive detected.
- If the page being tested is detected to be using HTTP/2, this audit won’t affect the user.
- Combine images using CSS sprites
- If the page being tested serves multiple small and spritable images, the audit will be triggered.
- Note, this audit has different thresholds, depending on whether the page being tested used HTTP/1.1 or HTTP/2.
- Whether the site being tested is using a Content Delivery Network (CDN)
- The GTmetrix report will flag any static resources it perceives as being able to be served from a CDN.
- Avoid CSS @Import
- Avoiding CSS @import when possible is still a recommended practice, as any import directives encountered by the browser (without the defer attribute) will be immediately downloaded, parsed, and executed. This can block the rendering of the rest of the page being tested.
The complete details of the Structure Score are listed in the Structure Tab of the GTmetrix Report.
 Now, you may be wondering – do my Structure Scores affect my Performance Scores?
Nope. But, improving your Structure SCores can generally improve the performance of the page/site you tested overall. Which in the end does result in better Performance Scores, and by extension, a better GTmetrix score overall.
You should think of the individual Structure Audits as ingredients in the recipe that is building a good, responsive, and performant website.
All About Web Vitals
Google established Web Vitals as the core metrics you should focus on when attempting to deliver a fast website/web app experience.
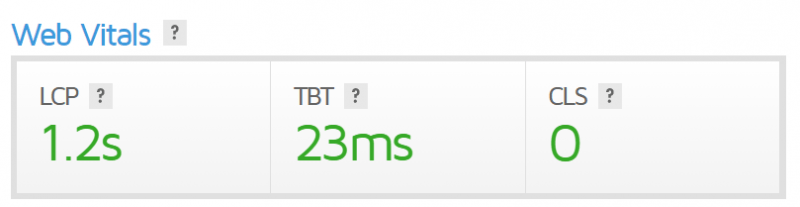 The Web Vital metrics include the following:
- Largest Contentful Paint (LCP) – this measures how long it took your largest content element to display.
- Total Blocking Time (TBT) – this measures how much time was blocked by scripts during the page load.
- Cumulative Layout Shift (CLS) – this measures how many layouts shift the user experienced when they loaded your website/web app.
If you’re doing well on these metrics, it’s a pretty good indicator that you’re delivering a fast and what Google calls a “delightful experience” to your visitors.
Reporting: Just the facts ma’m
The new release of GTmetrix brings a new release of reporting. Let’s take a look at the reports and examine each section.
The Summary Tab
This tab is new to GTmetrix Reports and shows you a complete snapshot of the performance, structure, and load behavior. You should consider any issues which appear here to be action items. The information alone in this section can provide significant guidance in improving your page’s performance.
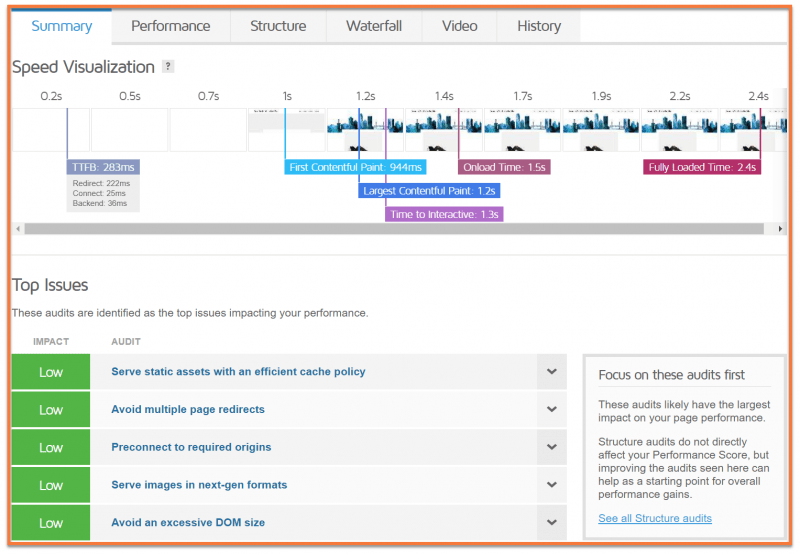
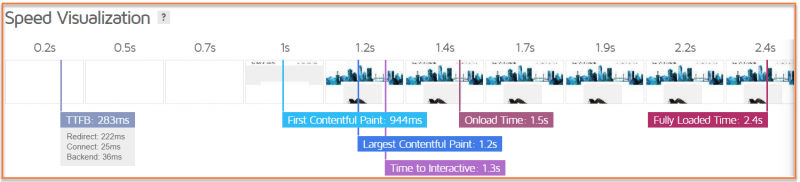
Speed Visualization
At the top of the report is the Speed Visualization, which is an interval capture of the page load with flags that mark your various Performance Score metrics as your website loads.
Top Issues
The audits listed here have a critical impact on the performance of your website/web app. Fixing these has a HUGE effect on the other Structure audits and can dramatically improve your overall GTmetrix Grade and Performance / Structure Scores.
As you fix things suggested by the audits and rest test, you’ll see new audits appear for you in the issues section. This allows you to prioritize what you want to fix (or have your developer fix), based on the impact on your page performance. Very cool!
Page Details
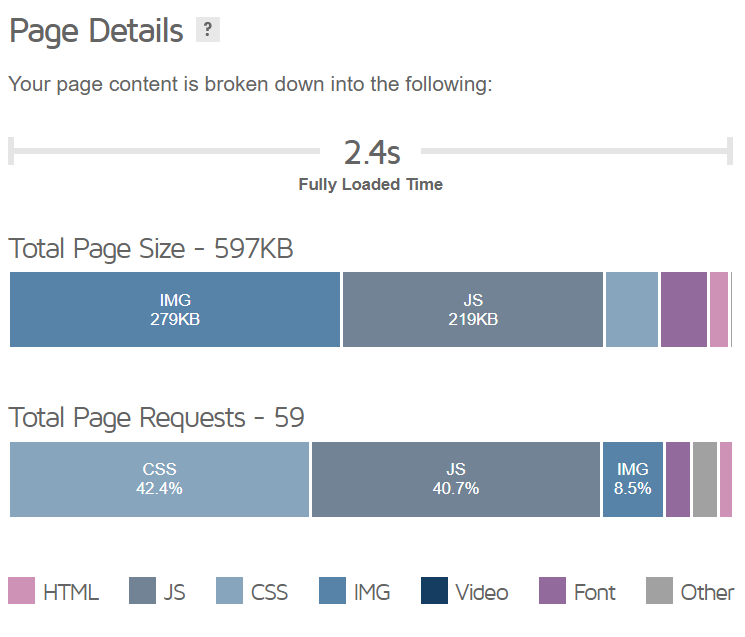
The Page Details section shows you a graphic of what type of requests your page is made up of, including the number of requests required to load the page/web app and the byte size they make up.
The Page Details section is also super useful for figuring out if your webpage is super heavy on assets like JavaScript, CSS, and Images.
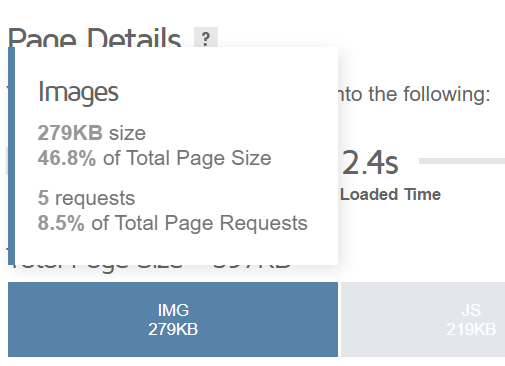
If you hover over a particular segment of the graph you’ll see additional information on that request type as a whole.
More from GTmetrix
This isn’t a section for Ads from GTmetrix, though it does kinda look like it. GTmetrix, if you’re reading, consider changing the UI on this section to look less like a CTA for a sales scheme.
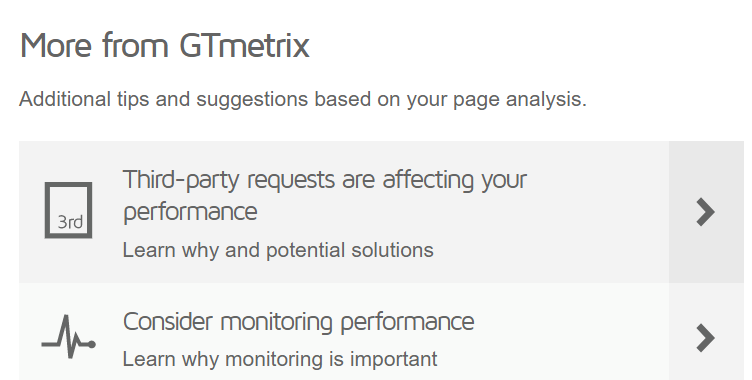 The tips that appear here are based on what GTmetrix detects during the testing of the web page/app. They may offer tips and guidance based on your platform, like if you’re using WordPress they may offer suggestions on how to improve the performance of your WordPress installation, what kind of plugins you can use, and more.
The Performance Tab
In the updated version of GTmetrix, the Timings Tab has been retired and replaced with the new Performance Tab, which shows your Performance Score metrics in great detail!
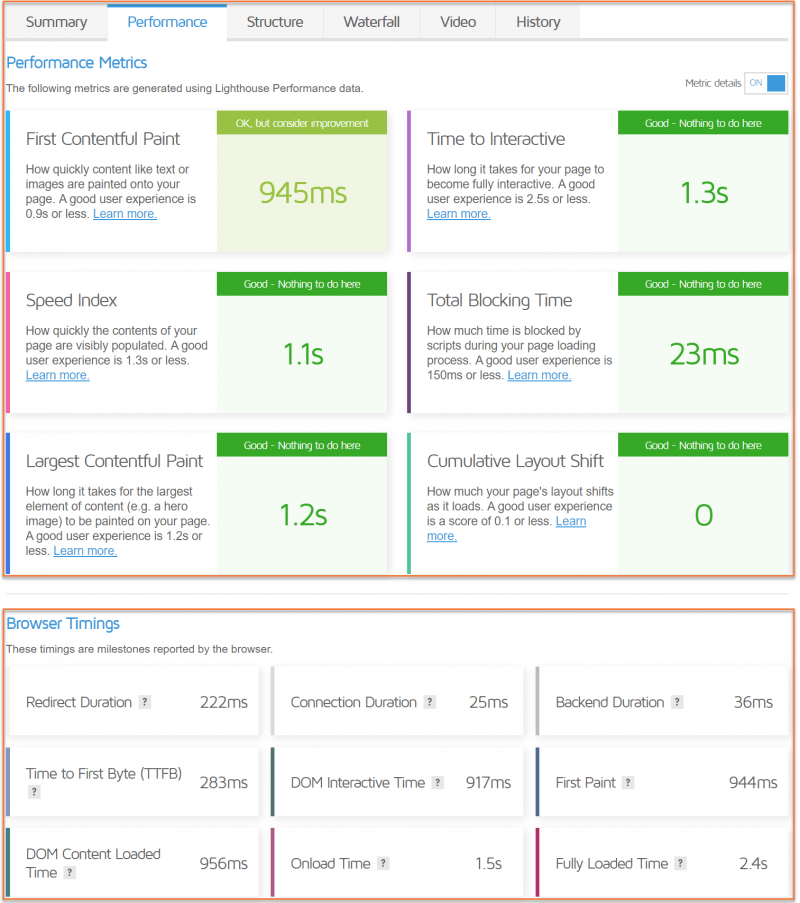 Each metric in the Performance tab comes with a description (which I’ve enabled for you to see) this way you know what it means at a quick glance. Additionally, the metrics are color coded to indicate how well you did on that metric.
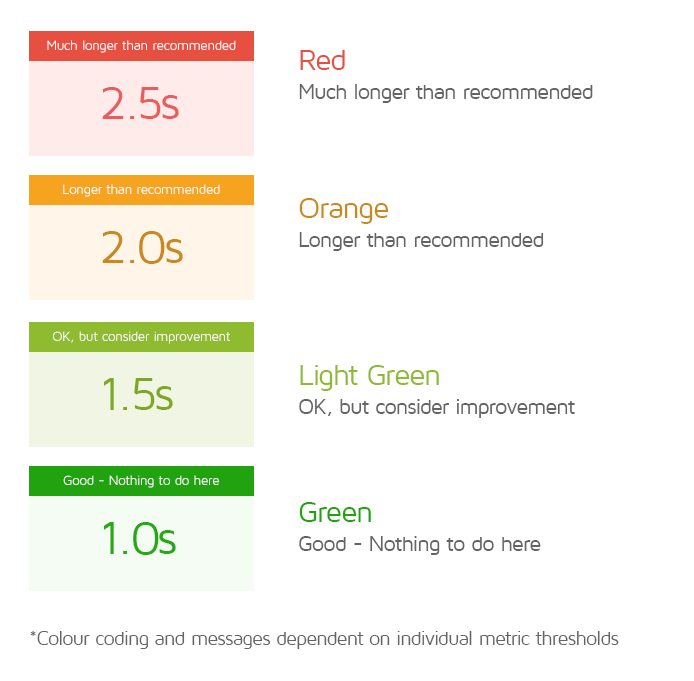
What do the individual color codes mean?
Not to worry! We’ve got your back. Check out what the color codes mean below:
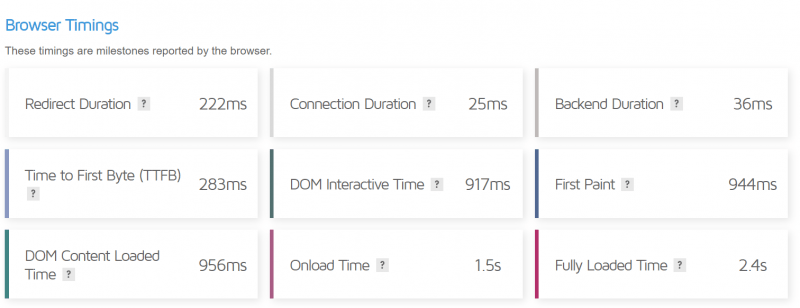
 Beneath the Performance Score metrics section is the Browser Timings. These have no impact on your Performance score, but they should provide additional information on the performance of your page or app and are definitely worth having a look through.
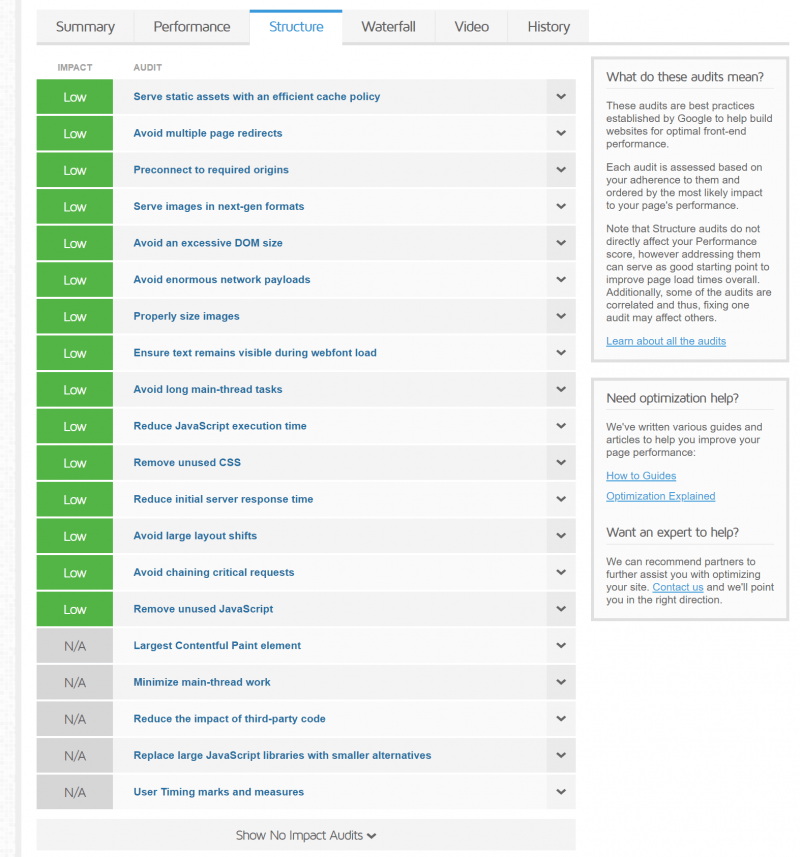
The Structure Tab
The Structure Tab is the successor to the PageSpeed and YSlow tabs from the Legacy Reports which contain your Structure-based Lighthouse audits and best practices for optimal website/web app performance.
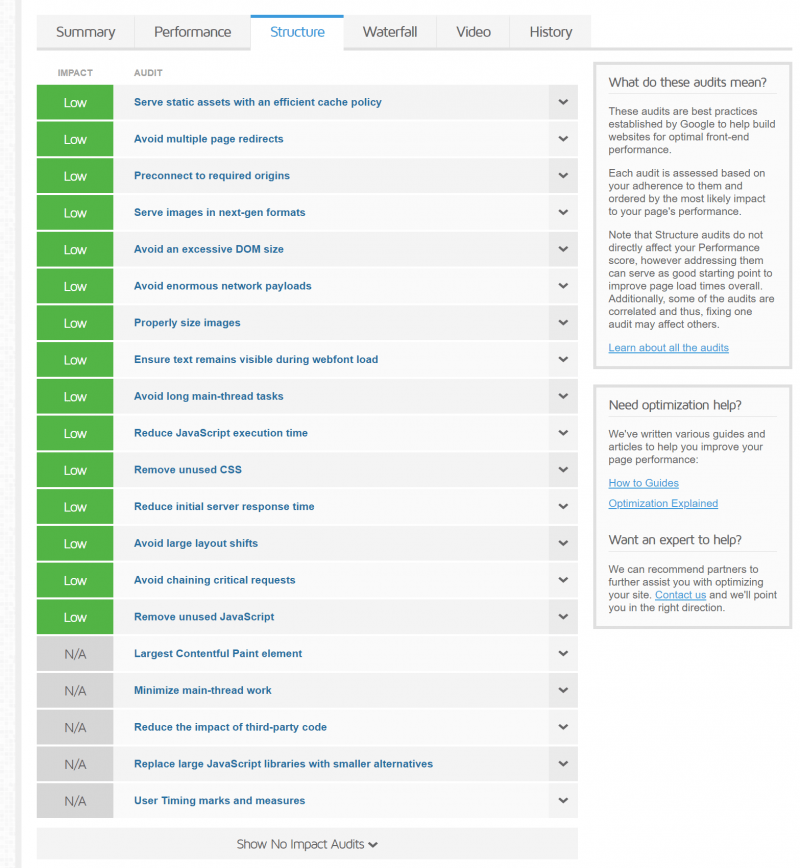 The image above is a great representation of a site that doesn’t need much work to make it better, however, your site may not fare so well, depending on it’s configuration. If you do have audits that need improvement, you’ll see a table-based layout with all of the audits organized based on how well you adhere to them, with the worst-performing at the top.
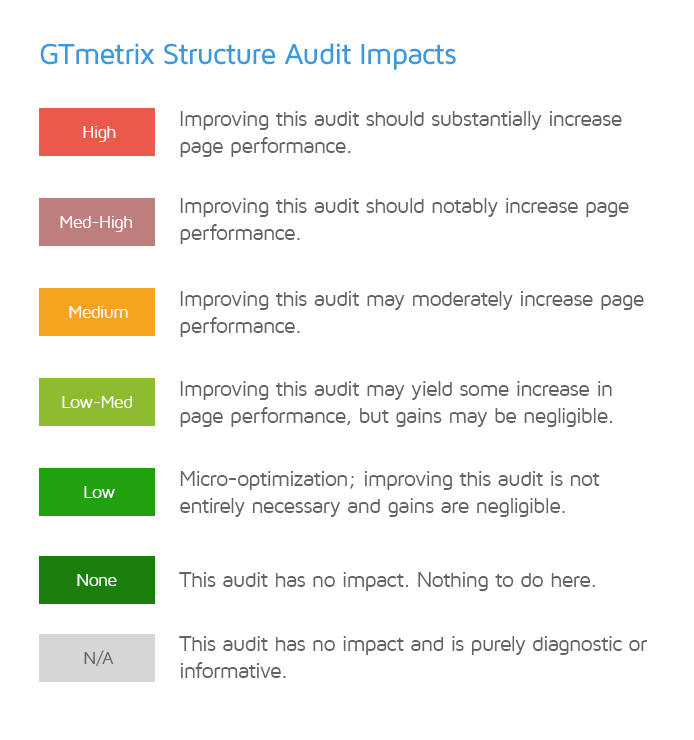
One new feature to this updated version of GTmetrix Reporting is the Impacts for audits, which is their proprietary assessment that consists of potential savings, impact on your metrics, and other considerations you should think about. The impact basically represents how much the particular audit impacted your Performance Score. They are calculated based on the findings of each analysis, then placed in one of the following thresholds:
 Your aggregate Impacts from each audit are calculated and tallied up to form the page’s Structure Score. Clicking the drop-down next to each audit will expand it and reveal the results which contributed to the impact of the audit.
Aren’t there 3 other tabs?
Yes, and they remain largely unchanged from the previous version of GTmetrix. Below is an overview of the updates in this version of GTmetrix:
- Waterfall Tab
- The GTmetrix Waterfall change has not changed in this version of GTmetrix and provides an excellent comparison to data from Lighthouse.
- Video Tab
- The Filmstrip which was previously in the Video Tab has been removed, and in it’s place a Speed Visualization has been installed on the Summary Page.
- History Tab
- Changes to the History Tab include the addition of new graphs for the Performance Score metrics and the replacement of the PageSpeed and YSlow graph with the new GTmetrix Grade/Performance and Structure Scores Graph.
How does the new GTmetrix Report compare to the Legacy Report?
Well, for the most part, there is no comparison. The metrics are now based on Lighthouse, which is fundamentally different compared to the previous PageSpeed and YSlow Recommendations. The reports may share some timings, but they are not a one-to-one comparison.
The new GTmetrix Report is an all-new benchmark for site owners to assess the performance of their websites or web apps.
Summary
This version of GTmetrix is the most comprehensive yet to hit the Web and has been completely redesigned to integrate the new data from Lighthouse testing, which will most likely change the entire way you assessed the performance of your site.
If you need some resources on “How To Optimize” your site for better results in GTmetrix, you can always open a ticket from your Lab or live chat and ask our Happiness Engineers to check your site and make some recommendations!
We hope this comprehensive coverage of the new GTmetrix reporting helps you better understand what you’re seeing when you run a report and isn’t just geek speak to you.
Let us know what you think in the comments!