

Google may be known for creating some great products, then killing them off right as they are coming into their own, but they are also known for creating some great web-based products to help people with their websites. Take Google PageSpeed Insights, for example. One of the few products Google’s created that doesn’t require you to sign in or give it any information, other than a URL and for free, PageSpeed Insights analyzes the content of a web page and spits out suggestions to make the page faster.
Sounds pretty cool, right?
With the dominance of Google Search and their “secret formula” for making it to the top of the SERP, let alone the first page, I mean, what is a better way to ensure you are doing everything you can to get to the top than by making recommendations on making your site faster from a utility developed by the same company?
In this blog, we’ll be covering exactly what the Google PageSpeed Insights tool does and how it can help you improve the performance of your website by using the recommendations the tool makes!
Let’s dive in!
Everything You Wanted To Know About Google PageSpeed Insights Tool
Table of Contents
- Everything You Wanted To Know About Google PageSpeed Insights Tool
- What is the Google PageSpeed Insights Tool?
- What does Google PageSpeed Insights measure?
- Opportunities (For Improvement)
- Eliminate render-blocking resources
- Properly Size Images
- Defer offscreen images
- Minify CSS
- Minify JavaScript
- Remove Unused CSS
- Efficiently encode images
- Serve images in modern formats
- Enable text compression
- Preconnect to required origins
- Reduce server response times (TTFB)
- Avoid multiple page redirects
- Preload key requests
- Use video formats for animated content
- Reduce the impact of third-party code
- Avoid non-composited animations
- Lazy load third-party resources with facades
- Does Google PageSpeed Insights affect SEO?
- How Can I Improve My PageSpeed Insights Scoring?
What is the Google PageSpeed Insights Tool?
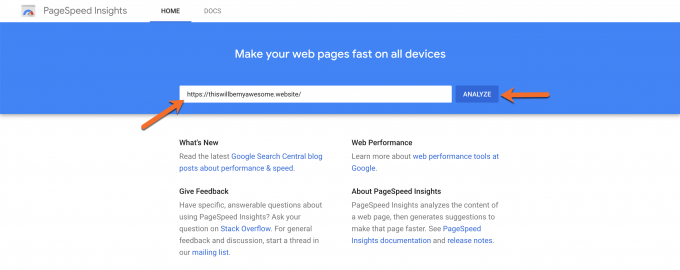
If you’re not familiar with the tool, go ahead and head over to the utility by clicking here. Once the page loads, insert any URL you want into the field and click the analyze button.
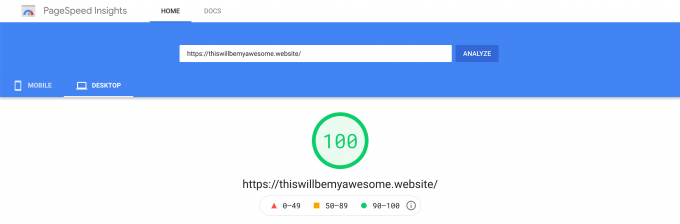
Once the analysis is complete, you’ll receive a score rated out of a possible 100 points for both Mobile and Desktop performance:
Along with the scoring, you’ll receive what are perhaps the most useful bits of information from the testing: the recommendations from Google on how to improve your website’s performance (and by extension, increase your scoring on Google PageSpeed Insights).
By taking these suggestions into consideration and making the necessary changes to your website, you should notice a huge improvement in scoring once you test again.
What does Google PageSpeed Insights measure?
Currently, Google PageSpeed Insights Insights scoring is generated by a tool called Lighthouse.
Lighthouse is an open-source, automated tool for improving the quality of web pages created by, yes, you guessed it, Google. The tool can be run against any web page, whether it’s public or requires authentication, and features audits for areas such as:
- Performance
- Accessibility
- Progress Web Apps (PWAs)
- Proper SEO
- and more.
Lighthouse is actually built into the Chrome DevTools, which is probably the easiest way to run the utility, however, you can also run Lighthouse from the command line or as a Node module, if you are so inclined. Alternatively, you can use Google PageSpeed Insights Insights to run the tool, however, if you want more information, we suggest using Google Measure.
Measure is a front-end for Lighthouse and conducts a performance audit much like the one that PSI does, however, Measure also gives you scores for Accessibility, Best Practices, and Search Engine Optimization (SEO), which is super handy.
Scoring
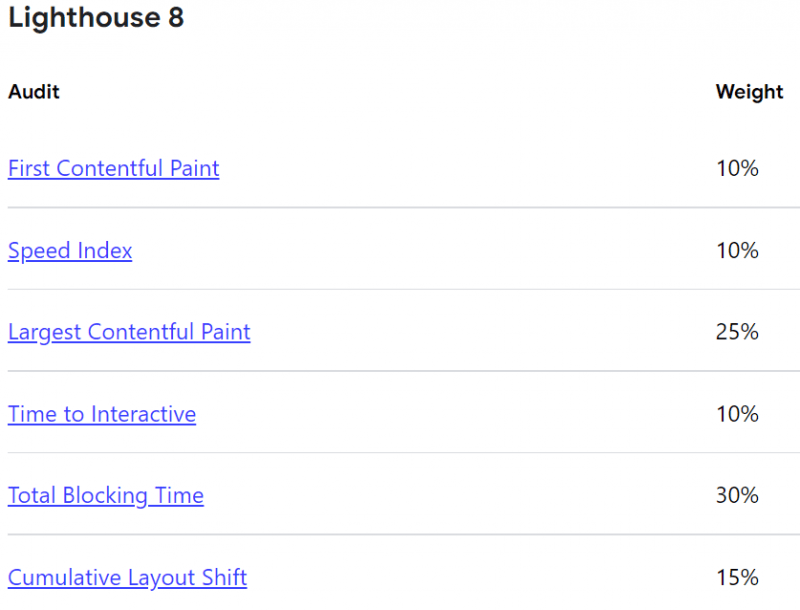
Lighthouse takes into consideration the following metrics when running its performance audits:
- First Contentful Paint
- First Meaningful Paint
- Speed Index
- First CPU Idle
- Time to Interactive
- Max Potential First Input Delay
- Total Blocking Time
- Largest Contentful Paint
When testing using Measure or PSI, one thing to keep in mind is that a lot of variability in the overall Performance score and individual metric values is not due to Lighthouse. When your Performance scores fluctuate, it’s likely due to some underlying conditions, such as:
- A/B Testing or ads being served.
- Traffic on the internet or the path your request took on the internet.
- Testing on different devices, such as using a high-performance desktop vs a low-performance laptop.
- Browser extensions that can inject JavaScript and add/modify network requests, such as ad blockers.
- Antivirus software that scans for internet threats.
Each of these has its own weights and the metrics are determined individually.
Let’s look at what each of these metrics means and how Lighthouse determines the score for each.
First Contentful Paint
FCP, or First Contentful Paint, measures how long it takes the browser to render the first piece of DOM content after a user navigates to your page. Images, non-white <canvas> elements, and SVGs on your page are considered DOM content; anything inside an iframe isn’t included.
Your FCP score is a comparison of your page’s FCP time and FCP times for real websites, based on data from the HTTP Archive. For example, sites performing in the ninety-ninth percentile render FCP in about 1.2 seconds. If your website’s FCP is 1.2 seconds, your FCP score is 99.
First Meaningful Paint
FMP measures when the primary content of a page is visible to the user. The raw score for FMP is the time in seconds between the user initiating the page load and the page rendering the primary above-the-fold content. FMP essentially shows the timing of the paint after which the biggest above-the-fold layout change happens.
First Contentful Paint (FCP) and FMP are often the same when the first bit of content rendered on the page includes the content above the fold. However, these metrics can differ when, for example, there’s content above the fold within an iframe. FMP registers when the content within the iframe is visible to the user, while FCP doesn’t include iframe content.
Speed Index
Speed Index measures how quickly content is visually displayed during page load. Lighthouse first captures a video of the page loading in the browser and computes the visual progression between frames. Lighthouse then uses the Speedline Node.js module to generate the Speed Index score.
Your Speed Index score is a comparison of your page’s speed index and the speed indices of real websites, based on data from the HTTP Archive.
This table shows how to interpret your mobile Speed Index score:
| Speed Index (in seconds) | Color-coding |
|---|---|
| 0–3.4 | Green (fast) |
| 3.4–5.8 | Orange (moderate) |
| Over 5.8 | Red (slow) |
First CPU Idle
First CPU Idle measures how long it takes a page to become minimally interactive. A page is considered minimally interactive when:
- Most—but not necessarily all—UI elements on the screen are interactive, and
- The page responds, on average, to most user input in a reasonable amount of time.
Your First CPU Idle score is a comparison of your page’s First CPU Idle time and First CPU Idle times for real websites, based on data from the HTTP Archive. For example, sites performing in the ninety-fifth percentile render First CPU Idle in about 3 seconds. If your website’s First CPU Idle is 3 seconds, your First CPU Idle score is 95.
This table shows how to interpret your First CPU Idle score:
| First CPU Idle metric (in seconds) | Color-coding | First CPU Idle score (HTTP Archive percentile) |
|---|---|---|
| 0–4.7 | Green (fast) | 75–100 |
| 4.8–6.5 | Orange (moderate) | 50–74 |
| Over 6.5 | Red (slow) | 0–49 |
Time to Interactive
TTI measures how long it takes a page to become fully interactive. A page is considered fully interactive when:
- The page displays useful content, which is measured by the First Contentful Paint,
- Event handlers are registered for most visible page elements, and
- The page responds to user interactions within 50 milliseconds.
The TTI score is a comparison of your page’s TTI and the TTI for real websites, based on data from the HTTP Archive. For example, sites performing in the ninety-ninth percentile render TTI in about 2.2 seconds. If your website’s TTI is 2.2 seconds, your TTI score is 99.
This table shows how to interpret your TTI score:
| TTI metric (in seconds) | Color-coding |
|---|---|
| 0–3.8 | Green (fast) |
| 3.9–7.3 | Orange (moderate) |
| Over 7.3 | Red (slow) |
Max Potential First Input Delay
Max Potential FID measures the worst-case First Input Delay that your users might experience. First Input Delay measures the time from when a user first interacts with your site, such as clicking a button, to the time when the browser is actually able to respond to that interaction.
Lighthouse calculates Max Potential FID by finding the duration of the longest task after First Contentful Paint. Tasks before First Contentful Paint are excluded because it’s unlikely that a user will attempt to interact with your page before any content has been rendered to the screen, which is what First Contentful Paint measures.
Your Max Potential FID score is a comparison of your page’s Max Potential FID time and Max Potential FID times for real websites, based on data from the HTTP Archive. For example, if your Max Potential FID score in Lighthouse is green, it means that your page performs better than 90% of real websites.
This table shows how to interpret your TBT score:
| Max Potential FID time (in milliseconds) | Color-coding |
|---|---|
| 0–130 | Green (fast) |
| 130-250 | Orange (moderate) |
| Over 250 | Red (slow) |
Total Blocking Time
TBT measures the total amount of time that a page is blocked from responding to user input, such as mouse clicks, screen taps, or keyboard presses. The sum is calculated by adding the blocking portion of all long tasks between First Contentful Paint and Time to Interactive. Any task that executes for more than 50 ms is a long task. The amount of time after 50 ms is the blocking portion. For example, if Lighthouse detects a 70 ms long task, the blocking portion would be 20 ms.
Your TBT score is a comparison of your page’s TBT time and TBT times millions of real sites when loaded on mobile devices.
This table shows how to interpret your TBT score:
| TBT time (in milliseconds) | Color-coding |
|---|---|
| 0–200 | Green (fast) |
| 200-600 | Orange (moderate) |
| Over 600 | Red (slow) |
Largest Contentful Paint
LCP measures when the largest content element in the viewport is rendered to the screen. This approximates when the main content of the page is visible to users. See Largest Contentful Paint defined for more details on how LCP is determined.
Browser support for LCP launched in Chrome 77. Lighthouse extracts LCP data from Chrome’s tracing tool.
The table below shows how to interpret your LCP score:
| LCP time (in seconds) | Color-coding |
|---|---|
| 0-2.5 | Green (fast) |
| 2.5-4 | Orange (moderate) |
| Over 4 | Red (slow) |
Opportunities (For Improvement)
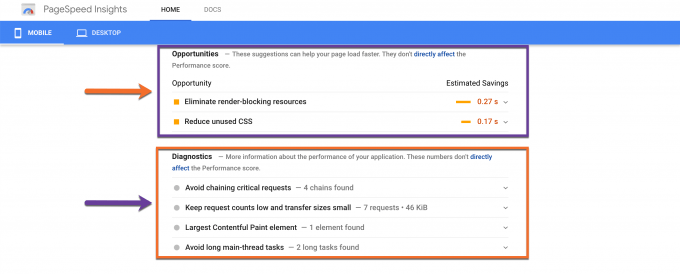
If the scoring comes back showing your site needs improvement, you will see a section called Opportunities appear with suggestions on what to do:
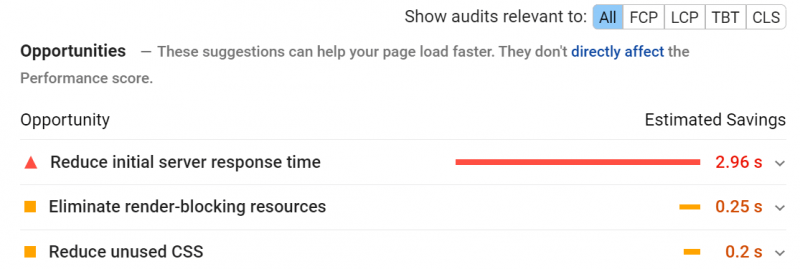
There are 17 Opportunities that can be given, depending on the results. Because not all of them will show on every website, we’ve prepared a list below, along with details on what each of the Opportunities is below:
- Eliminate render-blocking resources
- Properly size images
- Defer offscreen images
- Minify CSS
- Minify JavaScript
- Remove unused CSS
- Efficiently encode images
- Serve images in modern formats
- Enable text compression
- Preconnect to required origins
- Reduce server response times (TTFB)
- Avoid multiple page redirects
- Preload key requests
- Use video formats for animated content
- Reduce the impact of third-party code
- Avoid non-composited animations
- Lazy load third-party resources with facades
Eliminate render-blocking resources
If the Opportunities section of your report lists all URLs blocking the first paint of your page, then the goal is to reduce the impact of these render-blocking URLs by inlining critical resources, deferring non-critical resources, and removing anything that isn’t used.
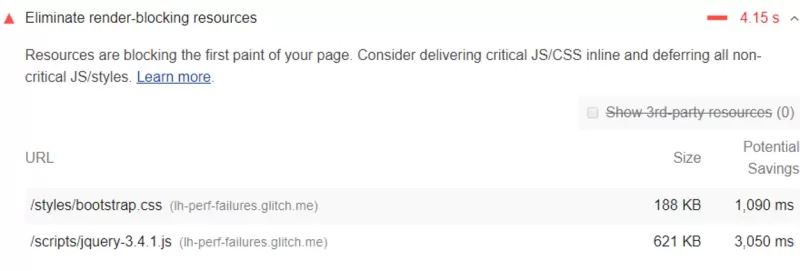
As we’ve mentioned, these results are generated by the Lighthouse application. Lighthouse flags just two types of render-blocking URLs:
- Scripts
- Stylesheets
If one of the following is true for your <script> tag, it will be flagged:
- It is in the <head> of the document.
- It does not have a defer attribute.
- It does not have an async attribute.
If one of the following is true for your <link rel=”stylesheet”> tags, it will be flagged:
- It does not have a disabled attribute. (When this attribute is present, the browser doesn’t download the stylesheet.)
- It does not have a media attribute that matches the user’s device specifically.
- FYI: The media=”all” tag is considered render-blocking.
Properly Size Images
If the Opportunities section of your report lists all images on your page that are not sized accordingly along with the potential savings in kibibytes (KiB) for resizing them, you should resize the images to improve page load time and also save on data transfer. Remember, lightweight pages will rank higher.
Lighthouse will compare the size of the rendered image against the size of the actual image for every image on your site. The rendered size will also factor in the device pixel ratio and if the rendered size is 4 KiB or less than the actual size of the image, it will fail the audit.
Defer offscreen images
If the opportunities section of your report lists all offscreen or hidden images on your page along with the potential savings in KiB, you should consider lazy-loading these images after all critical resources have finished loading to lower the Time to Interactive.
Minify CSS
If the Opportunities section of your report lists all unminified CSS files, along with the potential savings in kibibytes (KiB) when these files, you should considering minifying your CSS to improve performance. Whether you do this in your page’s code or at the CDN level is up to you.
For example, if you have a CSS file with the following layout:
/* Header background should match brand colors.
*/ h1 { background-color: #000000;
}
h2 { background-color: #000000;
}
This can be minified to:
h1, h2 { background-color: #000000; }To the browser, the 2 code samples are functionally the same, but the second example uses less space by removing character breaks and therefore is fewer bytes in size. You could reduce this even further to:
h1,h2{background-color:#000000;}if you wanted by using a minifier plugin. Some of these plugins are quite powerful and use clever tricks to minimize bytes used in CSS files. For example, if you have a color value of #000000 stated, it can be reduced to #000 which is the shorthand equivalent of the color code.
Minify JavaScript
If the Opportunities section of your report lists all unminified JavaScript files along with the potential savings in kibibytes (KiB) when these files are minified, you should consider minifying your JavaScript files to reduce payload sizes and script parse times.
This type of minification can be done by an application such as Terser or you can do this at the CDN level, as well.
Remove Unused CSS
If the Opportunities section of your report lists all stylesheets with unused CSS that would have a (potential) savings of 2 KiB or more, you should consider removing this unused CSS to reduce unnecessarily
Below is an example of how unused CSS slows down performance:
Using a <link> tag is a common way to add styles to a page:
<!doctype html>
<html>
<head> <link href="main.css" rel="stylesheet">
...
The main.css file that the browser downloads is known as an external stylesheet because it’s stored separately from the HTML that uses it.
This means a browser must download this file, parse through it, and then process all external stylesheets that are encountered before it can even display and render any content from the page to the user’s screen. If the browser were to attempt to display content before the stylesheets have been processed, there would be FOUC issues and everything would look funny because the stylesheets contain the guidelines that dictate the styling on that page.
As each stylesheet must be downloaded via the network, the extra network trips significantly increase the time that users have to wait before the page they requested even loads.
Furthermore, this unused CSS also slows down the creation of a browser’s render tree.
If you aren’t familiar with a render tree, think of it like the DOM tree, except that it includes the styles for each node.
To build this tree, the browser must walk thru the entire DOM tree and check which CSS rules apply where and to which node. The more unused CSS code there is, the more time the browser is probably going to need to spend calculating the styles for each node in the code. (Rhymes nicely, right?)
Efficiently encode images
If the Opportunities section of your report is listing all of your unoptimized images with the potential savings in kibibytes (KiB), you should consider optimizing these images so the page loads faster and consumes fewer data over the network.
The way the testing flags images as optimizable are by collecting all JPEG or BMP images on the page, then set the compression level to 85. After this, the system compares the original version with the compressed version. If the potential savings are greater than 4 KiB, then the image is flagged as being optimizable.
There are a lot of ways you can optimize images, and it all depends on 2 things:
- Your website’s architecture.
- Your preference.
Really, it’s more about your preference than about the architecture of your site. However, if your site is a Ruby on Rails powered blog, then you may want to optimize images at the CDN level or consider lazy loading them. But if your site runs on WordPress, you could consider using a plugin to optimize them after upload, or a CDN.
You can also consider replacing animated GIFs with a video where appropriate, and even using WebP images, which are quite smaller and easier to load via the network.
Serve images in modern formats
If the Opportunities section of your report is listing all images in older image formats, such as JPEG and PNG, then you should consider the potential savings gained by converting your images to updated formats. This one is fairly new actually and is very similar to optimizing your images since how you do this will depend on your website’s architecture and your personal preference.
Image formats like JPEG2000, JPEG XR< and WebP often provide better compression than formats such as PNG and JPEG, which means faster downloads and less consumption of data, which is especially important on mobile networks.
You can also consider serving images in WebP and/or AVIF format, as both offer superior compression and quality characteristics compared to their counterparts, JPEG and PNG. If you opt to encode your images in these formats, instead of using JPEG and PNG, they will load faster and consume fewer data.
Keep in mind where WebP and AVIF are supported.
WebP is supported in the latest versions of:
- Chrome
- Edge
- Firefox
- Opera
- Safari
Google published an excellent page on WebP and how they believe it’s the future of images on the web which you can review here.
AVIF is supported in the latest versions of:
- Chrome
- Opera
Enable text compression
If the Opportunities section of your report is showing uncompressed text based-resources that can be served with compression, you should strongly consider doing so.
When handling text compression, Lighthouse will gather all responses which:
- Have text-based resource types.
- Do not include a content-encoding header to set to br, gzip, or deflate.
Lighthouse then compresses each of these with GZIP to compute the potential savings.
If the original size of a response is less than 1.4KiB, or if the potential savings in compression is less than 10% of the size of the original file, then Lighthouse won’t flag the response in the results.
Enabling text compression is fairly easy these days. Typically when a browser requests a resource, it will use the Accept-Encoding HTTP request header to indicate which compression algorithms the server supports, similar to:
Accept-Encoding: gzip, compress, br
If the browser you’re using supports Brotli (br), you should use this because it can reduce the file size of the resources more than the other compression algorithms. However, you can use GZIP as a fallback to Brotli, which is supported in all major browsers, but is just less efficient when compared to Brotli.
Preconnect to required origins
If the Opportunities section of your report is listing all key requests which aren’t yet prioritizing fech requests with <link rel=preconnect>, you should consider adding ‘preconnect’ or ‘dns-prefetch’ resource hints to establish early connections to important third-party origins.
The <link rel=”preconnect”> tag informs the browser that your webpage intends to establish an off-site connection to another origin and that you’d like that process to begin asap. Establishing these types of connections often involves more significant time in slower networks, particularly when it comes to secure connections as it involves DNS lookups from sources that may not be cached, redirects, and several round trips to the final server which handles the user’s request.
But by taking care of this ahead of time, you can make your application or website feel much snappier to the end-user without negatively affecting the use of bandwidth in the process. Much of the time, in establishing these connections, is spent waiting rather than exchanging any data.
Informing the browser of your intent to establish these connections to third-party origins is as simple as adding a link tag to your page, such as:
<link rel=”preconnect” href=”https://www.your-third-party-url-here.tld”>
This tells the browser that the page being requested intends to connect to the URL provided above and retrieve content from that destination.
Do keep in mind, however, while using this tag is a great idea, it still expends valuable CPU time, particularly on secure connections. This is particularly bad if the connection isn’t used within 10 seconds, as the browser will close the connection out, wasting all of that early connection work.
Instead, try to use the following tag as a performance tweak:
<link rel:"preload">
and keep:
<link rel="preconnect">
in your arsenal for edge-cases.
Reduce server response times (TTFB)
If the Opportunities section of your report is coming back with the suggestion to reduce server response times (TTFB), you should consider fixing this.
The audit fails when the user’s browser waits more than 600 milliseconds for the server to respond to the request for the main document. Users tend to dislike when pages take a long time to load and slow server response times are one possible cause for these slow page loads.
Think about it, when users are navigating to a URL in their browser, the browser has to make a network request to fetch the content the user is requesting. Your server receives this request and returns the requested content. It’s possible the server is having to do a lot of work in order to return a page with all of the content that the user wants. Optimizing the server to do the work as quickly as possible is one way to reduce the number of time users will spend waiting for pages to load.
How do you improve this you may ask? Well, the first step to improving server response times is identifying the tasks your server must complete before returning page content, then measuring how long each of the tasks takes. Once you’ve identified the longest tasks, search for ways to optimize them or speed them up.
There are a lot of causes for slow server response. Here are my top 3:
- Slow or oversold web servers. You may need to upgrade your web hosting plan or server hardware with more memory, CPU, or I/O cycles.
- Optimize your database and how your server queries those databases, or migrate to a faster database system.
- If you use a server framework, consider optimizing the logic in its configuration to prepare pages faster.
Avoid multiple page redirects
If you’re seeing this in your Opportunities results, then you should really consider whether you need these page redirects. Redirects slow down your page load speed. Why is this?
Well, when a browser requests a resource that has been redirected, the server usually returns an HTTP response like:
HTTP/1.1 301 Moved Permanently
Location: /path/to/new/location
This means the browser must make yet another HTTP request to the new location to retrieve the resource. This additional trip and added network latency can delay the loading by hundreds of milliseconds.
Consider eliminating these by pointing to links to flagged resources to their current locations.
If you’re using redirects to divert mobile users to a mobile version of your website, consider redesigning your site to use a responsive design.
Preload key requests
If the Opportunities section of your report is listing this, you should consider using <link rel=preload> to prioritize fetching resources that are currently requested later in the page load.
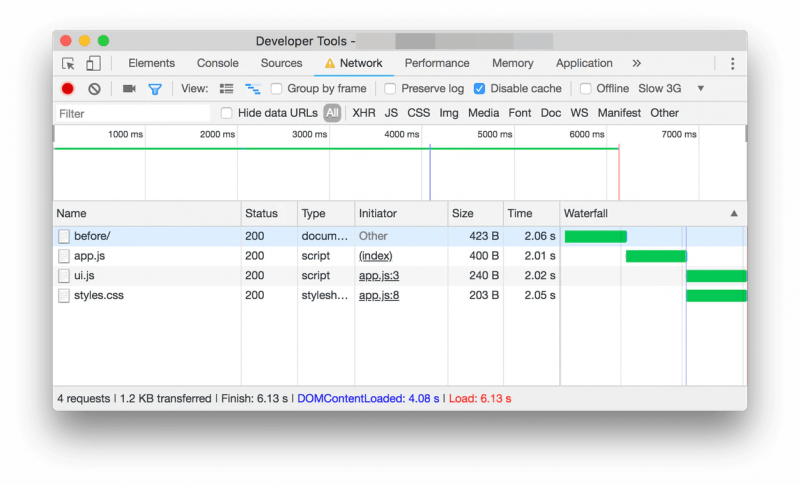
Let’s assume your page’s critical request chain is like this:
index.html
|--app.js
|--styles.css
|--ui.js
This means your index.html file declares <script src=app.js”>, so when app.js runs, it calls fetch() in order to download styles.css and ui.js. As a result, the page requested won’t appear complete until those final 2 resources are downloaded, parsed, and executed.
Using the example above, the system would flag your syles.css and ui.js as candidates for prioritization.
Preloading these pages can make your page load even faster. Look at the waterfall below in the example:
If you know your styles.css and ui.js are important, you should declare your preload links so they are downloaded as soon as possible. You can see this being done in the example below:
<head>
...
<link rel="preload" href="styles.css" as="style">
<link rel="preload" href="ui.js" as="script">
...
</head>
Take a look at what happens in the waterfall below when they are loaded at the same time instead of later on in the page load:
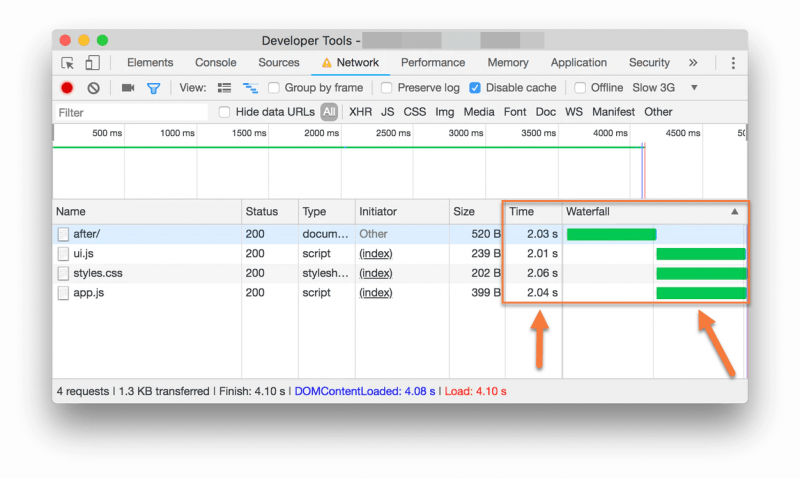
By declaring them in preload, they all load simultaneously, resulting in a much faster page load overall.
Use video formats for animated content
If you’re seeing a suggestion to use video formats for animated content in your Opportunities report, you should consider replacing the files listed with video, such as MEPG4/WebM.
There are a lot of ways to do this, but the easiest perhaps overall is my favorite app – Handbrake.
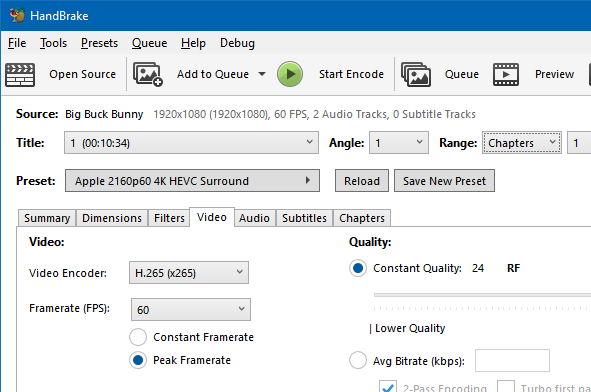
Handbrake can convert video from and to nearly any format. It’s also free and open-source software, which makes it great for everyone to use. The application is also supported on all three major Operating Systems – Linux, Mac, and Windows.
With Handbrake’s built-in presets, you can get started in seconds to convert video to smaller, more web-friendly formats.
Reduce the impact of third-party code
If you’re seeing this suggestion in your PageSpeed report, you should really consider limiting the number of redundant third-party providers and try to load third-party code after your page has primarily finished loading.
To add something like an advertising network, A/B test, social media ‘like’ or ‘share’ button, and even analytics services to your page, you usually need to add a third-party script to your HTML. These can significantly affect your page load performance and Lighthouse will flag any pages which feature third-party code that blocks the main thread for 250ms or longer.
Avoid non-composited animations
These can be somewhat complex and if you are seeing them as suggestions in the Opportunities section of your report, you should really look into fixing this.
Non-composited animations are animations that appear janky (not smooth-loading) on low-end phones or when performance-heavy tasks are running on the main thread. These animations can increase the Cumulative Layout Shift (CLS) of your page and reducing any CLS on your site will always improve your PageSpeed Insights score.
When an animation can’t be composited, Chrome reports the failure reasons to the DevTools trace, which is what Lighthouse reads. Lighthouse lists DOM nodes that have animations that were not composited along with the failure reason(s) for each animation.
You can ensure animations are composited by sticking to compositor-only properties and managing layer count and using high-performance animations.
Lazy load third-party resources with facades
If you are seeing some third-party resource that can be lazy-loaded with a facade as a suggestion in the Opportunities section of your PageSpeed Insight results, you should consider doing so.
Third-party resources are often used for displaying ads or videos and integrating with social media. The default approach for these resources is to load them as soon as the page loads, but this can slow down the page unnecessarily. If the third-party content isn’t critical, you should consider lazy-loading it.
Lighthouse looks for third-party products which can be deferred, such as social button widgets or video embeds (for example, YouTube embedded player).
Instead of adding a third-party embed directly in your HTML, load the page with a static element that looks similar to the actual embedded third-party. It would look something like this:
- On load, add facade to the page.
- On mouseover, the facade pre-connects to the third-party resources.
- On user-click, the facade replaces itself with the third-party product.
Does Google PageSpeed Insights affect SEO?
This is an excellent question!
Considering PageSpeed Insights is a tool brought to you by the world’s dominant search engine, you might question whether your scoring has some effect on your SERP (Search Engine Results Page) ranking.
If you were inclined to say yea, my PSI scoring probably does affect my SERP Ranking, then you are correct! Congratulations, you win the Internet for the day, go buy a lottery ticket!
It is absolutely correct that Google does use your PSI (PageSpeed Insights) scoring to determine your ranking on Search Engine Results Pages…… well, sort of.
No one knows the exact formula Google uses to display your rankings, but we do know that even reaching 100/100 on the PSI score isn’t going to guarantee you 1st place on the SERPs, however, the score does give you a pretty good idea of where you stand to be ranked.
Your overall SEO is the key to making it to the top on Google, and your PSI is factored into this. However Google breaks this down may still be a mystery, but we know that improving your SEO is the key to getting higher up on those rankings, especially when it comes to mobile page speed. We know that since July 9, 2018, Google has been factoring in mobile page speeds into site rankings.
If you’ve been paying attention, this is why PageSpeed Insights provides you with a desktop and a mobile score.
How Can I Improve My PageSpeed Insights Scoring?
There’s a number of things you can do to improve the overall health of the code on your site and therefore increase your scoring.
Let’s look at some of the more popular ways to do this below:
Website Best Practices
The page lacks the HTML doctype, thus triggering quirks mode
Are you seeing this error flagged in your report?

This means your page doesn’t have a <!DOCTYPE> declaration.
Specifying a doctype prevents the browser from switching to quirks mode, which can cause your page to render in unexpected ways.
How to add a doctype declaration
Add the <!DOCTYPE html> declaration to the top of your HTML document:
<!DOCTYPE html>
<html lang="en">
…
Browser errors were logged to the console
Are you seeing this error flagged in your report?
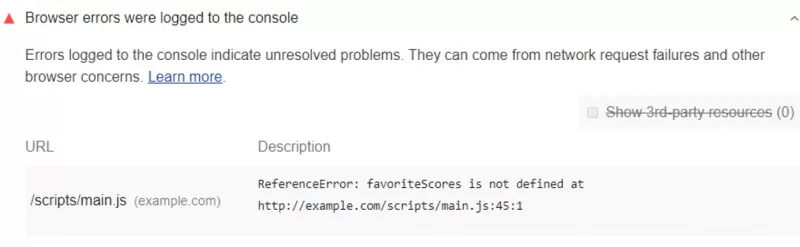
Most modern web browsers ship with integrated developer tools, for example, the Chrome DevTools. These developer tools feature a console that gives information about the page that’s currently running in the browser window. The messages that appear in the console either come from the developers who built the page or the browser itself.
In the console, all messages have a severity level, such as:
- Verbose
- Info
- Warning
- Error
An Error message means there’s a problem on your page that you need to resolve.
Here is an example of two errors:
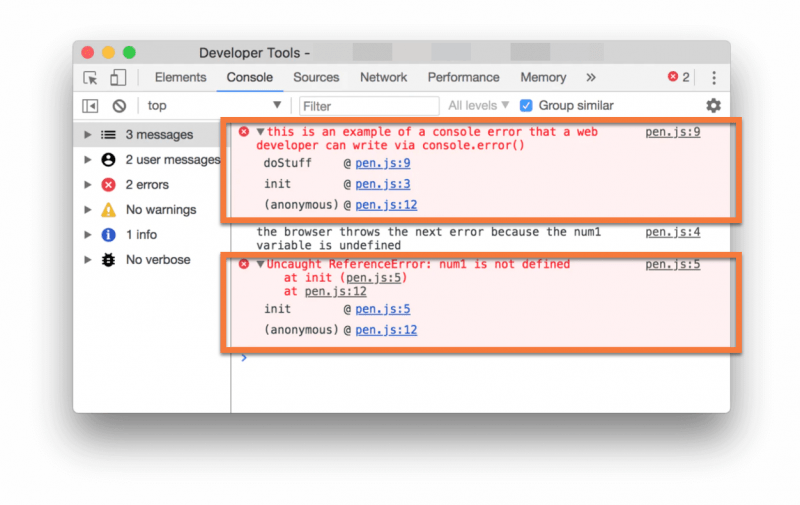
In the example above, the first error stems from a web developer via a call to console.error().
The second error comes from the browser itself and indicates that a variable used in a script on one of the pages requested doesn’t exist.
Below the text of each of the errors, the Chrome DevTools indicate the call stack in which the error appears. For example, the Console shows that an (anonymous) function called the init function, which is called the doStuff function, for the first error message. Clicking the pen.js:9 link in the top right of that error will show you the relevant code where things went wrong.
By using the Chrome DevTools to review the relevant code for each error, you can quickly identify and resolve any problems with your site.
If you can’t fix an error, consider wrapping it in a try…catch statement to explicitly indicate in the code that you’re aware of the issue. You can also use the catch block to handle the error more gracefully.
Displays images with the incorrect aspect ratio
Are you seeing this in your Google PageSpeed Insights report?
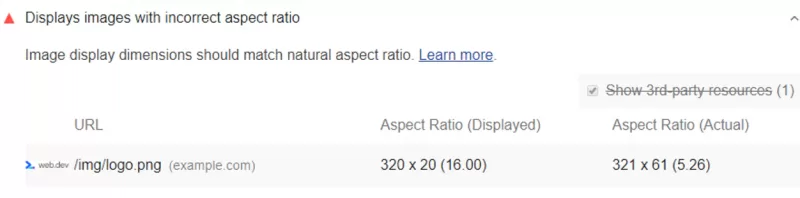
This error means that a rendered image has an aspect ratio that is significantly different from the aspect ratio in the source file, i.e. its natural aspect ratio. Because of this, that image will likely appear poorly rendered and/or distorted, which looks ugly to the eyes.
There are two common causes for an incorrect image aspect ratio:
- An image is set to explicit width and height values that differ from the source image’s dimensions.
- An image is set to a width and height as a percentage of a variably-sized container.
Here are some ways you can ensure images display correctly and with the proper aspect ratio:
- Use an Image CDN – An image CDN makes it easier to automate the often tedious process of creating different-sized versions of your images.
- Check the CSS that affects the image’s aspect ratio – If you’re having some difficulty finding the CSS code that’s causing the incorrect aspect ratio, Chrome’s DevTools can show you the CSS declarations that affect the image. See here for Google’s documentation on how to do this.
- Check the width and height HTML attributes of the image – It’s good practice to specify each image’s width and height attributes in your HTML code so the browser can allocate space for the image when rendering your page. This helps ensure that the content below doesn’t shift when the image is loaded, preventing CLS errors.
- We know this can be difficult when you’re working with responsive layouts, so consider using the CSS Aspect Ratio library or aspect ratio boxes to help preserve those aspect ratios for your images.
Make your pages more secure
Are you seeing this in your Google PageSpeed Insights report?
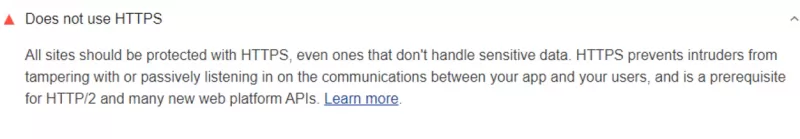
All websites should be protected with an SSL Certificate and should use HTTPS, even if the website isn’t handling sensitive data, like credit card numbers or medical information. HTTPS prevents intruders from tampering with and passively listening in on the communications between your site and your users.
Google will actively downrank your site for not using HTTPS, as well.
If you need a free SSL Certificate to bring your site into 2021, ChemiCloud offers free Let’s Encrypt certificates that work for most basic sites!
Links to cross-origin destinations are unsafe
Are you seeing this in your Google PageSpeed Insights Insights report?
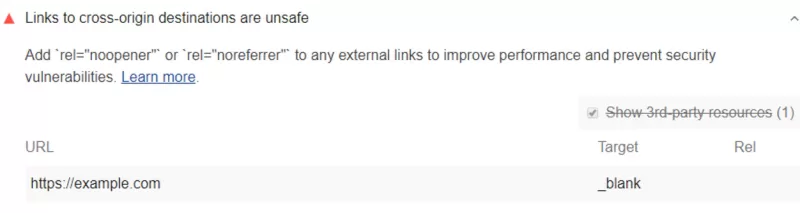
When you link to a page on another website using the target=”_blank” attribute, you’re exposing your site to performance & security issues.
Also, did you know when you do this the other page may run on the same process as your page and if it’s running a lot of JavaScript (for example), your webpage’s performance could suffer as a result.
Furthermore, the other page can access your window object with the window.opener property which could allow the other page to redirect your site to a malicious or naughty URL.
Avoid this by adding rel=”noopener” or rel=”noreferrer” to your target=”_blank” links.
Includes front-end JavaScript libraries with known security vulnerabilities
Are you seeing this in your Google PageSpeed Insights report?
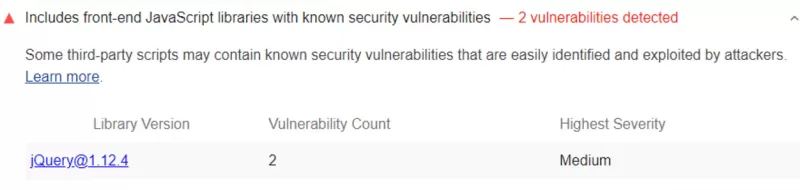
You should be aware that intruders have automated web crawlers that can scan your website for known security vulnerabilities. When their crawler tools detect one, it alerts the intruder and from there they just need to sort out how to exploit that hole in your security.
To fix this, you should stop using each of the libraries that are flagged. If the library has released a newer version that fixes the vulnerability, upgrade to that version in your code. If the library hasn’t released a new version or you find it’s no longer being maintained, consider using a different library.
Click the links in the Library Version of a column of your report to learn more about the vulnerabilities in each library.
Ensure CSP is effective against XSS attacks
Are you seeing this in your PageSpeed Insights report?
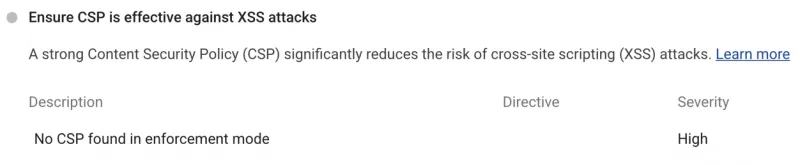
A good Content Security Policy (CSP) helps ensure any content loaded on the page is trusted by the owner. They mitigate cross-site scripting (XSS) attacks because they can block unsafe scripts injected by attackers. Did you know though that the CSP can be easily bypassed if it’s not strict?
To prevent this, check out this write up on Mitigating cross-site scripting (XSS) attacks with a strict Content Security Policy.
You should also be aware there are some required practices for a non-bypassable CSP, such as:
CSP targets XSS
To target CSS, your Content Security Policy should include the script-src, object-src, and base-uri directives. The CSP should also be reviewed and checked to be sure it’s free of any syntax errors. The script-src and object-src directives secures a page from unsafe scripts and unsafe plugins, respectively, while base-uri prevents the injection of unauthorized <base> tags that could be used to redirect all relative URLS (namely, scripts) to a domain controlled by the attacker.
CSP uses nonces or hashes to avoid allowlist bypasses
Any CSP that configures an allowlist for script-src will wily on the assumption that all responses coming from a trusted domain are safe and can be executed as scripts. But this doesn’t hold true for modern applications. Some common or benign patterns, such as exposing JSONP interfaces or even hosting a copy of the AngularJS library could allow an attacker to escape the confines of your Content Security Policy.
To avoid being bypassed, a CSP should allow scripts individually using nonces or hashes and use ‘strict-dynamic’ instead of an allowlist.
Make your pages faster
Does not use HTTP/2 for all of its resources
Are you seeing this in your PageSpeed Insights report?
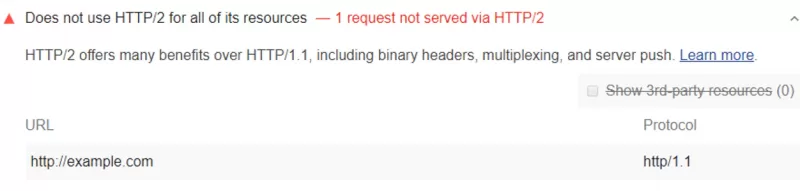
HTTP/2 serves your pages resources way faster than HTTP/1 and uses less data, as well.
You should consider serving your resources over HTTP/2 if you are seeing this error.
At ChemiCloud, we support HTTP/2 and you can enable this by using a plugin, such as LiteSpeed Cache for WordPress, for example.
Uses document.write()
Are you seeing this in your PageSpeed report?
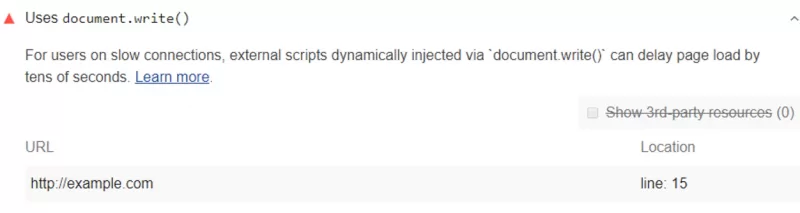
By using document.write(), you can delay the display of a page by tens of seconds and it’s particularly problematic for users on slower internet connections. Chrome, therefore, blocks the execution of document.write() in many cases, which means you cannot rely on it working.
If you are using it, you’ll see this in the ChromeDevTools:
[Violation] Avoid using document.write()
In the Firefox DevTools Console you’ll see this message:
An unbalanced tree was written using document.write() causing data from the network to be reparsed.
You should consider removing all uses of document.write() where they appear in your code. If it’s being used to inject third-party scripts, try using asynchronous loading instead. And if code from a third-party add-in is using document.write(), you should ask them to support asynchronous loading in a future update.
Use passive listeners to improve scrolling performance
Are you seeing this in your PageSpeed report?
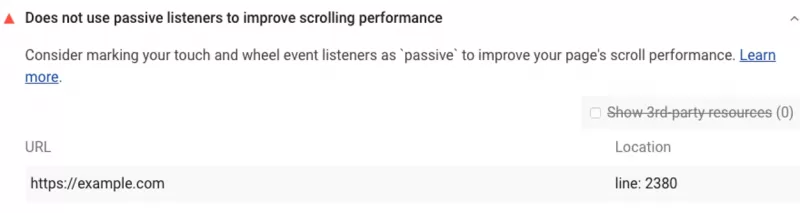
These event listeners, called touch and wheel event listeners, are useful for tracking interactions and creating custom scrolling experiences on your site, however, using them can also delay page scrolling. Complicating matters, currently, browsers cannot know if an event listener in the code will prevent scrolling, so the browser always waits for the listener to finish executing before scrolling the page.
Passive event listeners solve this conundrum by letting you indicate that an event listener will never prevent scrolling, making the browser a happy app.
You can make event listeners passive to improve scrolling performance by adding a passive flag to every event listener that PageSpeed Insights detected.
If you’re only supporting browsers that have passive event listener support, just add the flag. Here’s an example:
document.addEventListener('touchstart', onTouchStart, {passive: true});If you’re supporting old browsers that don’t support these, you’ll need to use feature detection or a polyfill.
Avoid deprecated technologies
Are you seeing this in your PageSpeed report?

If so, you should consider using the Cache API instead of the Application Cache. Just remove the manifest from your page and use the Cache API via a service worker. If you need to migrate from the Application Cache to service workers, consider using the sw-appcache-behavior library, which generates a service-worker-based implementation of the behavior.
Uses deprecated APIs
Are you seeing this in your PageSpeed report?
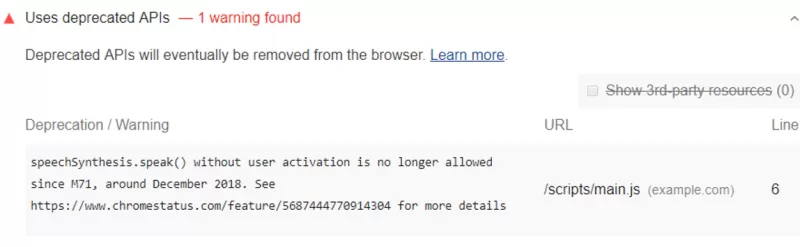
You should know that deprecated APIs are scheduled to be removed from Chrome in future releases, and by extension Chromium, which means browsers like Microsoft Edge, which uses the Chromium engine, will not support calling them.
For each of the calls you see mentioned in the report, you should consider removing it or finding a more current library. Check the Chrome Platform Status page and expand the entries for the APIs that you are presently using, and the site will tell you why they were deprecated and will also help you replace them.
Create a good user experience
Requests the geolocation permission on page load
Are you seeing this in your PageSpeed report?
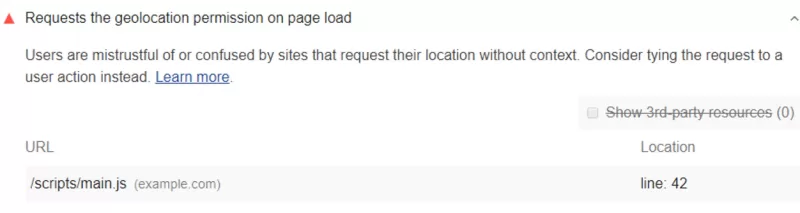
You should know by having your site do this, you could be lowering the trust of your users. Users tend to be mistrustful of or confused by pages that automatically request their location.
Instead, consider asking for the user’s location in a more responsible way.
Remove all calls to gelocation.getCurrentPosition() and geolocation.watchPosition() that occur on page load. And look into providing a better user experience by:
- Always requesting geolocation permission after a user does something, not just on page load.
- Clearly indicate that doing said action will cause the browser to request their geolocation.
- Always assume users won’t give this to you.
- Use a fallback if users don’t grant permission.
Requests the notification permission on page load
Are you seeing this in your PageSpeed report?
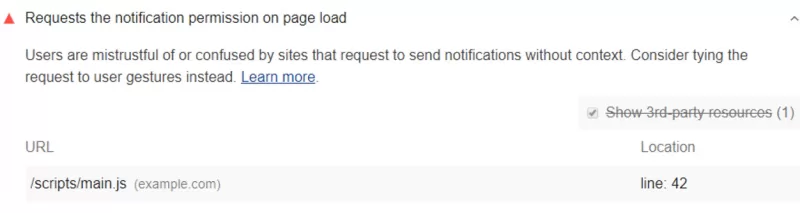
Doing this can really irritate your users. Good notifications are timely, relevant, and precise. If your page is randomly asking for permission to send notifications on page load, they may not be relevant to your users or their needs, and they’re probably going to decline.
Instead, consider asking for the user’s permission to send notifications more responsibly by:
- Offering to send the user a very specific type of notification, rather than broad-spectrum notifications.
- Presenting the permissions request to send notifications after the user opts into the notification type.
Prevents users from pasting into password fields
Are you seeing this in your PageSpeed report?
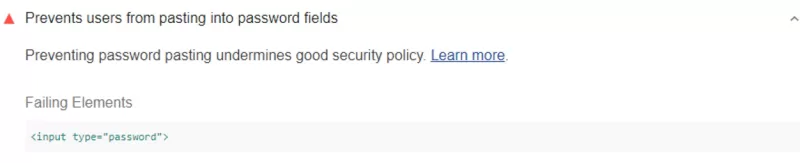
Stop me if you’ve heard this before – not being able to paste passwords reduces site security.
This is wrong.
Password pasting actually improves security because it enables the user of password managers.
A good passwords manager will typically generate strong passwords for its users, and also store them securely, then automatically paste them into fields whenever a user requests the resource to login.
You should consider enabling pasting into password fields and removing the code that’s preventing them from being pasted in.
Typically the source of this problem is a call to preventDefault() within the paste event listener that’s associated with the password input element. If you’re only listening to paste events to preempt them, remove the entire event listener.
Well, there you have it, everything you wanted to know about the Google PageSpeed Insights tool and probably a lot more!
Tell us your thoughts and ideas in the comments!


2 thoughts on “Everything You Wanted To Know About Google PageSpeed Insights Tool”
Hi,
Thank you so much for sharing this amazing information. Very helpful information; once again, thank you so much.
Hey there,
Our pleasure!